税込み送料無料 40ドル以上のご注文で
税込み送料無料 40ドル以上のご注文で

A Complete Guide to Cycling Power Zones: 5 Methods for Personalization and Calibration

August 11, 2026

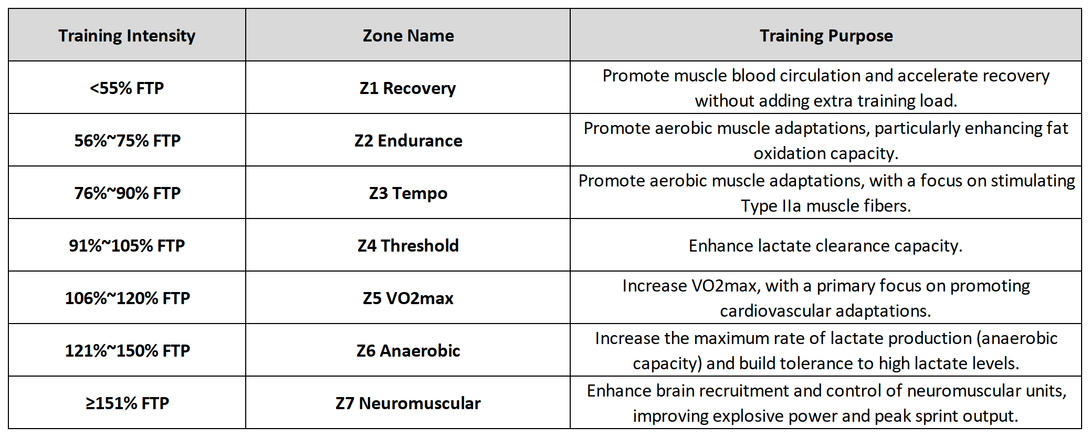
In cycling power training, achieving targeted physiological adaptations requires matching your training intensity precisely to the corresponding power zones.

For instance, to reduce the accumulation of lactate and associated fatigue-inducing metabolic byproducts, we typically aim to train at an intensity that maximizes fat oxidation rates. Similarly, to elevate maximum oxygen uptake (VO2max), training intensity must be sufficiently high—nearing the maximum oxygen uptake rate—yet controlled enough to allow an athlete to sustain the effort for a meaningful total duration.

The Classic Baseline: Andrew Coggan's Power Zone System

Several classic power zone models exist today, with Andrew Coggan’s power zone standard being the most widely adopted in the industry. All such training zone systems essentially divide training intensity based on percentages of a single physiological metric—such as Functional Threshold Power (FTP), VO2max, Threshold Heart Rate, or Maximum Heart Rate (HRmax).

Limitations of Classic Models

While these models are statistically valid across large populations, they have inherent limitations: relying on a single physiological metric to define training zones does not work universally for every cyclist. Therefore, to maximize training efficiency, riders need to personalize and fine-tune their power zones based on their unique physiological profiles.

Beyond Single Metrics: 5 Methods for Personalizing Power Zones
Method 1: Self-Paced Testing

Riders can perform non-power-capped, self-paced tests on an indoor smart trainer.

Sample Test Protocol (Classic VO2max Session):

6 sets of 3-minute high-intensity intervals with 3-minute recovery between sets.

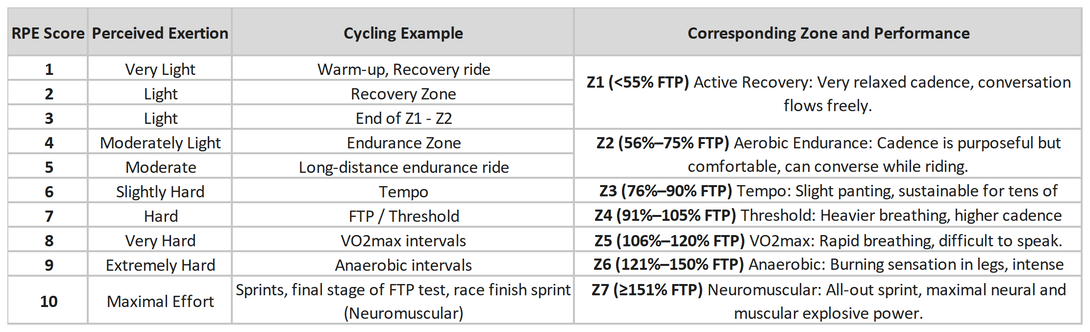
Perform the test blind to power output data, maintaining a steady cadence. Target an overall Rating of Perceived Exertion (RPE) of 8 on a 10-point scale.

The final interval should require an all-out effort to complete, without reaching a full sprint limit.

Calibration Logic:

Record the power data throughout the session and adjust subsequent training targets based on actual output. For example, if a rider consistently holds 130% FTP during VO2max intervals (where standard VO2max zones typically fall between 106% and 120%), it indicates that their standard anaerobic targets are set too low and should be adjusted upward.

Method 2: Power Profile Testing

Combined with self-paced testing, a comprehensive power profile test evaluates a rider's strengths and weaknesses across the entire power spectrum.

Testing Protocol:

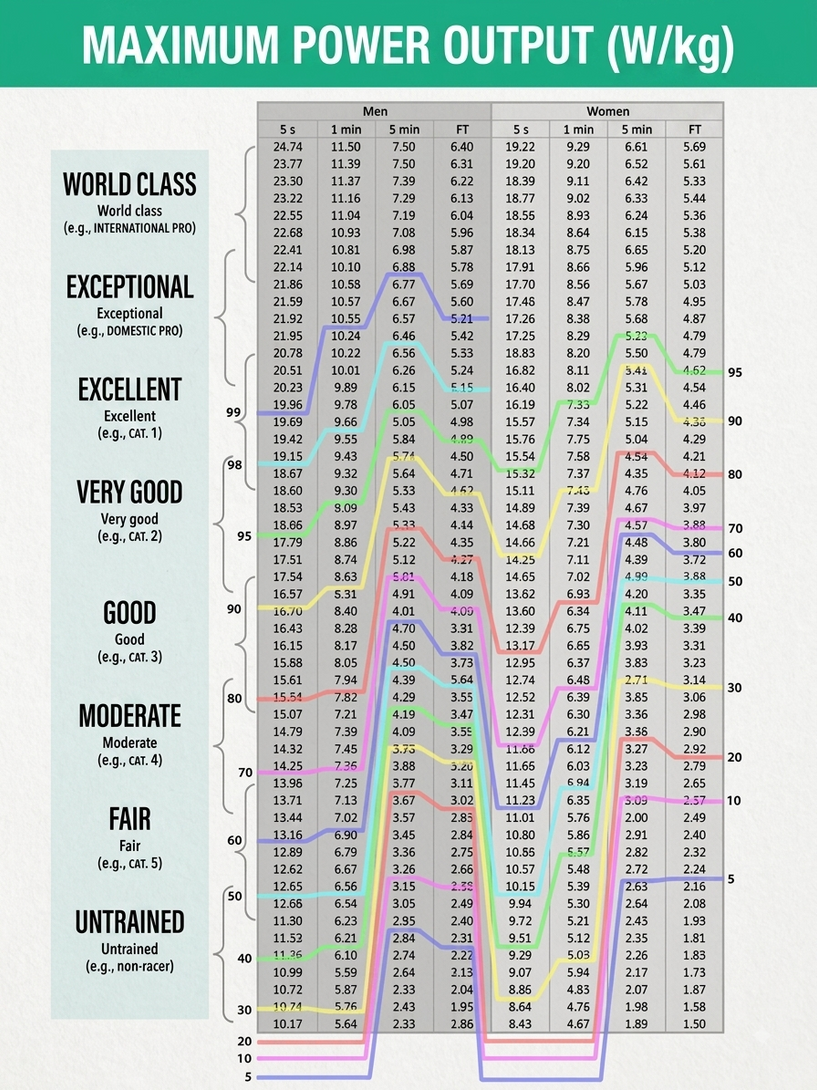
The protocol involves multiple all-out, steady-pace efforts measuring maximum output at 5 seconds, 1 minute, 5 minutes, and 20 minutes. Convert average power for each effort into power-to-weight ratio (Watts per kilogram, W/kg), then reference Coggan’s Power Profiling chart to pinpoint strengths and limiters.

Physiological Capacities Corresponding to Duration:

5-Second Peak Power: Neuromuscular Power / Sprint Capacity

1-Minute Max: Anaerobic Capacity

5-Minute Max: Aerobic Capacity (VO2max)

20-Minute Max: Lactate Threshold (approx. 95% of 20-minute mean maximal power)

Data Interpretation Example:

If data shows a rider's 20-minute endurance performance far outweighs their 1-minute sprint (i.e., excellent lactate threshold rating, but borderline anaerobic power), the target power for anaerobic intervals should be scaled down.

How to Read the Power Profiling Chart

Example: A male cyclist's power test results are as follows:

Corresponding Performance Level:

Rider Profile Summary:

  • Strong explosive power
  • Strong anaerobic capacity
  • Relatively moderate aerobic capacity
  • Categorized as a sprinter-type rider

Global Rider Classifications by W/kg

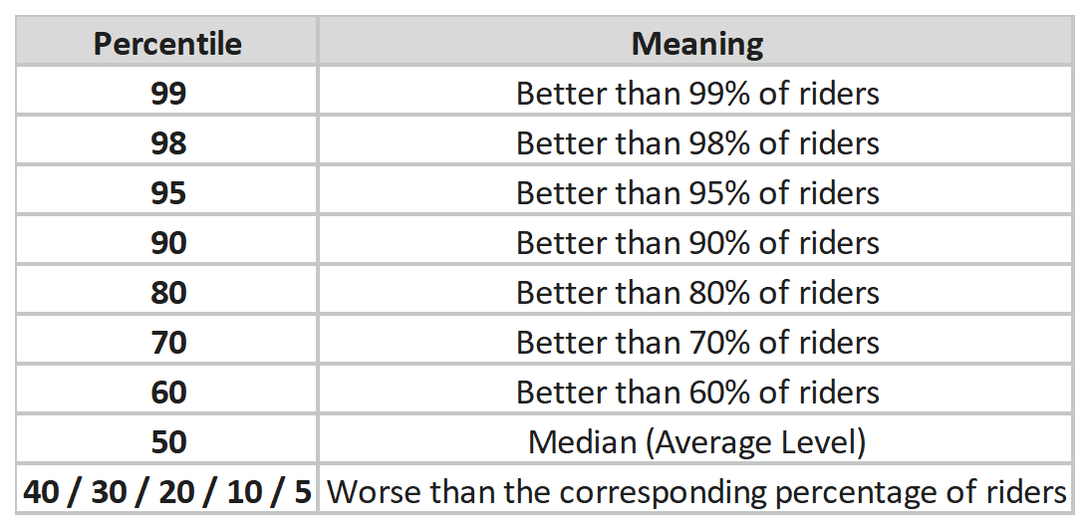
Global Percentile Rankings for Male & Female Riders by W/kg
Method 3: Heart Rate-Assisted Calibration

This method specifically validates VO2max (aerobic capacity) interval training. Because heart rate and oxygen uptake show an approximately linear relationship within specific ranges, heart rate serves as a reliable indicator of whether a rider is working close to their VO2max zone.

Execution and Fine-Tuning:

Target Zone: During VO2max intervals, the target heart rate range is 90% to 95% of maximum heart rate, indicating that training intensity is close to peak aerobic demand.

Heart Rate Lag: Heart rate response lags behind power output, following the same physiological delay as oxygen uptake. It typically takes 1 to 2 minutes into an interval to hit the 90%–95% target zone; this is normal and does not indicate insufficient initial power.

Optimizing Interval Structure: Heart rate tracking helps optimize interval structures to maximize time spent at high heart rates. Strategies include micro-bursts (30 seconds all-out / 15 seconds rest) or hard-start intervals (starting slightly higher, then easing into target pace) to rapidly elevate heart rate and sustain it.

Accurately Determining Your Maximum Heart Rate:

Precise knowledge of maximum heart rate is required for this method. The traditional formula "220 - Age" carries significant individual variance. Recommended alternatives include:

1. Reviewing historical ride data from high-intensity races (especially final sprints) or all-out field tests to find peak heart rate values.

2. Obtaining maximal heart rate recorded during an incremental ramp test in a laboratory setting.

Note: Heart rate is influenced by fatigue, fueling, hydration, stress, hormones, and environmental factors. Avoid adjusting power targets based on a single ride's heart rate data. Repeat the workout protocol across multiple sessions and use average heart rate responses as a calibration baseline.

Method 4: Rating of Perceived Exertion (RPE)

Rating of Perceived Exertion (RPE) is a widely recognized subjective metric used across cycling, running, and general fitness. It provides a simple yet effective way to verify if interval intensity aligns with intended training zones. The Borg CR10 scale (RPE 1–10) is standard practice in international cycling coaching.

Because daily physical feel fluctuates, tracking average subjective effort over multiple workouts yields better insights than relying on a single session. Ride platforms like Strava allow athletes to record overall session difficulty alongside individual interval scores to track intensity alignment over time.

Method 5: Medical & Laboratory Testing

Laboratory testing remains the gold standard for defining and individualizing training zones. Professional testing protocols include:

Blood Lactate Testing

Cardiopulmonary Exercise Testing (CPET): Analyzes expired gases to measure oxygen consumption (VO2) and carbon dioxide production, quantifying real-time metabolic substrate utilization.

Muscle Oxygen Saturation (SmO2) Monitoring: Identifies localized physiological bottlenecks in muscle oxygen delivery and utilization.

Industry practice frequently utilizes CPET setups (incorporating metabolic carts, ergometers or treadmills, and 12-lead ECG monitoring) to measure precise VO2max values. These tests are widely available at sports science labs, cardiology departments, and human performance centers.

Conclusion

Establishing accurate, personalized training zones is an ongoing process. For day-to-day training, combining power metrics, heart rate response, and subjective RPE feedback delivers the most complete picture. Periodically re-evaluating these indicators ensures that every watt produced translates into maximum training value.